Tuesday, March 29, 2022

Conferences and Speaking

It's a busy time, but there is also lots of fun stuff happening! Besides my move to Powerdobs earlier this year, there are also several interesting conferences that caught my attention! Let me tell you about them.

SQLBits

For starters, at the beginning of this month there was SQLBits, were I (virtually) presented a session called Power Platform Better Together: Create a Scoring App with a Live Dashboard.
In this session I showed how to use Power BI, Power Automate and Power Apps to create an interactive application. While I loved to be there in-person, I made the decision earlier this year to present virtual due to all the uncertainty back then. Although I do regret it after seeing all the excitement on social media, I still have some travel plans to other conferences this year.

If you don't know SQLBits, it's probably the greatest Data conference in Europe, spanning a whopping 5 days, including the free community event Saturday.

Here's a few stats from the conference this year:

Thank you for attending SQLBits 2022, see you next year! It shows 3 arcade-like pictures of puppets (like Mario and Sonic).

  • Over 450 hours of training delivered
  • 232 speakers, over 25% of whom identify as diverse in our industry
  • 67 helpers
  • Over 1600 attendees Tue-Fri, with almost 2/3 in-person
  • Plus another 900 registrations for the free Saturday
  • Attendees from 38 countries
  • Over £8K raised for Ukraine, in support of two Ukrainian speakers and a Ukrainian helper
Session recordings are still being worked on and will become available for registered attendees. But, in case you missed out, slides are already available at their website.

Power BI Global Summit

I bet the Power BI Summit is known you all, it is the biggest Power BI conference in the world. A multi-day event with speakers from the Microsoft Power BI team’s product group, community experts and MVPs from all around the world. This time I had the honor of hosting a Table Talk around the topic of Power BI Service Administration and beyond at the Global Power BI Summit, with my friends Tom Martens ( B | @tommartens68), Ε tΔ›pΓ‘n ReΕ‘l ( B | @tpnRel1) and Benni De Jagere ( B | @BenniDeJagere). We actually did it twice that day, in the morning and the evening, to accommodate all time zones across the world.
There was a lot of interaction, people asking questions in chat but also coming on camera for a live chat. We even got some people answering questions from time to time, which is great for the engagement. And that way I also learned some new things!

MVP Summit

Although every conference has its perks, I am pretty sure this is the one I'm most excited about!
As a Microsoft Most Valuable Professional, you are eligible to attend the MVP Global Summit once a year, The event features a large catalog of in-depth technical discussions and feedback sessions, directly with the Microsoft product teams and engineers.
The MVP Award is a global program of recognized technology experts and community leaders who actively support technical communities through unique, innovative, and consistent knowledge sharing. These community leaders actively contribute to support the developer and IT Pro communities worldwide, helping them learn, build, and use our products.

My expectations are high! There will be a lot of demonstrations of functions and features that are not yet publicly available. Of course there are strict Non-disclosure agreements on all sessions on the MVP Summit, but that won't spoil the fun.

Due to the fact that the world is still not 100% back to normal, this year the Summit is still virtual, so the organizers are trying to accommodate all time zones. Most sessions are roughly from 4 PM until 5 AM here in Europe, so that's going to be a tough three days ahead... 😴


Power BI Gebruikersdag

Last but not least, this week also marks the start of the famous annual Dutch Power BI User Day: Power BI Gebruikersdag. It’s a great community event with lot's of local attendees and speakers.

You can have a look at a recap of one of the earlier conferences:


The association behind this user day has had a major overhaul, with 4 new board members, so I'm excited to see what they have been up to!

I'm also delighted to be presenting 2 sessions there:

  • A (big) look into Query Folding on Deep Dive Friday! I've done Query Folding before, but this is a 2-hour long session going into (all) the depths! πŸ˜€
  • Write-back with Power Apps in Power BI on Saturday, which is a new session, showing off how to use Power Apps inside Power BI to edit data in the backend.

Check the full schedule for all the sessions!


Closing

My very last point then, because in June I'll also be attending and speaking at DataGrillen, the only conference (I know of) that has Data, Bratwurst and Beer. πŸ˜€ But more about that later.

For everyone attending one of the conferences above, please come and say hi, ask a question, tell a story or just grab a drink and hang out! πŸ’›


Wednesday, February 23, 2022

My Favorite Power BI Desktop February 2022 New Features

Last week it was that time of the month again! No not that time.
I mean time for the Power BI February 2022 Feature Summary blog post by Jeroen ter Heerdt of course.

Dynamic M Query Parameters

The new thing is that dynamic M Query Parameters now supports SQL Server (and more data sources). There are several use cases that come to mind and a few people have already blogged about this:

The high level steps to dynamic M query parameters are:
  • The source (SP/TVF) has to be in DirectQuery mode
  • Create a parameter(s) in PQ
  • In the model view, bind that parameter(s) to the column in your datamodel
  • And then use the parameter(s) in your source in PQ
If you want to read up on all the features, supported datasources, limitations and risks, go read the documentation on how to use dynamic M query parameters.

New mobile formatting options

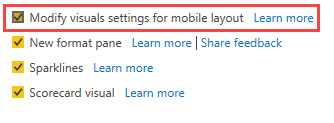
If you're into mobile formatting for Power BI, you're going to love this update. There's a lot more you can configure, now also independently from the web version.
To enable the new mobile formatting pane, the blog post says you'll have to enable the preview feature under Options, but after my installation of the February update it was already enabled:


And more...

Of course there's a lot more in the February update, to mention a few:

If you haven't started using Goals, there are more updates to it, including:
  • Teams notifications integration,
  • Multiple owners for a single goal and 
  • The ability to create scorecards in My Workspace
Deployment Pipelines enhancements: there's a (fairly) new Azure DevOps extension and multiple pipelines working together, for example for disconnected reports and datasets

Download .pbix improvements: starting with this release you can download a .pbix file in more scenario's. Specifically, if a report is connected to a dataset that is configured for large models, incremental refresh or has been modified using the XMLA endpoint, you are now able to download that (connected) report, so not the dataset itself πŸ˜‰
      Read up on all the gotcha's and limitations of this export to PBIX.


      Now go download that new update and check it out ourself! πŸ˜€


      Thursday, February 10, 2022

      Book Review: Expert Data Modeling with Power BI

      Somewhere last year I started reading this book on Power BI. It actually took me quite a while to finish it, because of [reasons]. πŸ˜€
      But now that I finally finished it, I thought it would be good to write a short review on my thougths about the book, so you know if it is worth your time and money.

      The book is from fellow-MVP Soheil Bakhshi (@biinsightnz | B) called Expert Data Modeling with Power BI


      TL;DR

      Yes, it is definitely worth it! 😁

      The long version

      I think the combination of good, practical examples and in-depth coverage of (Power BI) features is the best about this book. You can also follow along with the step-by-step examples, as I think going hands-on is the best way of learning things. With reading you can only pick up so much knowledge, while putting it in practice right away enriches the learning experience much more.
      Next to that, the book is also filled with best practices for data preparation as well as data modeling.

      Soheil is not afraid of touching upon and explaining more advanced and complex topics, like:

      • Incremental refresh
      • Calculation groups
      • Aggregations
      • The new composite models
      • Slowly changing dimensions

      One point of critique if you will: sometimes I felt that adding color to an image in the book, could get the message across better. But I also get that this makes the pages more crowded, and probably also more expensive, and is not the way Packt publishes their books πŸ˜€

      All in all I very much enjoyed reading this book! And I definitely learned a lot.
      I think I knew, or at least have heard of, all the features that were explained in the book. But if you've never used/implemented RLS you don't really know what you're up against. The same goes for aggregations or calculation groups for example. So reading up on those features with good examples has definitely enriched my knowledge.

      I've already started reading my next book, so stay tuned for another review!

      Monday, January 31, 2022

      Starting A New Adventure

      Van Lanschot Kempen

      Last Thursday I had my last day working at Van Lanschot Kempen (VLK), where I worked roughly 4 years. I did great things and also had a great time.
      Amongst others, I...
      • ...had a great time working with my colleagues, especially our coffee moments walking to the 12th floor!
      • ...started getting more and more involved with Power BI inside VLK
      • ...organized a Power BI meeting at our office together with PBIG, and did an intro into what VLK is doing at the data and Power BI level together with @JeroenSchalken
      • ...started a running club with my department, which lasted roughly for a year πŸ˜€
      • ...started speaking (with Jeroen) at PBIG 2019 with an extended version of our intro talk
      • ...went to Prague (with Jeroen), Mechelen, Dublin, Mechelen again 😁, and then everything went virtual...
      • ...got a promotion to Lead Expert within VLK
      • ...started going physical again to Copenhagen! Hopefully this will be the new norm again in 2022
      • And even received my MVP award!
      How I enjoyed that trip! Thank you everyone who contributed to this time! πŸ’›

      Powerdobs

      Tomorrow will be the start of a new trip, together with my colleagues at Powerdobs. It's a small consultancy firm located in Den Bosch (Netherlands), focused on delivering solutions through quality, craftsmanship, long-term relationships and being sober and caring.
      As the Unit Lead Power BI I'll be responsible for taking Power BI to the next level, both internally and externally. So expect to find me writing more blogs and doing more presentations!


      Will the road ahead be straight and paved? I doubt that. There'll be enough bends, sidetracks and obstacles and bumps. That's where others pick me up. That's where I learn and come back stronger. 
      And it will for sure be a great adventure!


      Friday, December 31, 2021

      Closing Out On 2021

      Well, this has certainly been an interesting year, to say the least.. 
      I thought I'd write up my findings of 2021, and have a little look into the future as well.
      And of course also for you all to keep me accountable for the goals I set in this post.

      Blogging

      Let's start with the best topic.. 😁 I managed to write a whopping 6 (six!) blog posts this year, of which 4 are from this month.. That is actually the lowest for one year since I've started blogging in 2011.
      My goal for next year is definitely to blog more, and more consistent! I think I already made a great start this month.

      Speaking

      While I had some great speaking engagements online in 2021, with 7 presentations in total the number is not that high. But the winner is definitely Power BI Next Step in Copenhagen, the first (and for me only) in-person event in 2021! It was great to be back and physically meet and see friends again. Also, the road trip with Marc (@MarcLelijveld | b) & his girlfriend was quite fun.
      I also have some plans for new presentations, and even have an in-person (new) presentation planned at DataGrillen!

      MVP

      This was certainly the highlight of 2020 and 2021, because on July 1st 2021, I received the great e-mail that I was (re-)awarded Microsoft Most Valuable Professional in the Data Platform category for the 2nd consecutive year.
      I've already learned so much from all the conversations and e-mails with other MVP's. And of course the direct links to the (Power BI) product teams are amazing!
      Thanks again to Jan Mulkens, Marc Lelijveld and Rishi Sapra for supporting me on this track.

      Learning/Reading

      While I do read a lot of blog posts to keep up with all the news in the Power BI and Power Platform world, I think I didn't actually finish any books this year. I do have 3 books still in progress at the moment which I started recently. I want to read a bit more and also more regularly next year.
      I also managed to do 2 exams in the first week of 2021: I passed both DA-100 and PL-900 in one day! πŸ₯³

      Running

      Just over 2 years ago I started as a member of the local athletics club, with training on a running track once a week. That helped me a lot in getting more regular in running. In 2020 I ran 1250 km, which was way more than I ever did. However, my goal for 2021 is set to 1800 km! And I managed to beat that 1800th km on this final day of the year! πŸŽ‰

      I also wanted to get a half marathon under 90 minutes, but that didn't go as planned. I got stuck at just over 92 minutes. That's a nice goal to finish next year!

      The motivation of my fellow runners on Twitter (#runhappy) helped me a lot, so THANK you!

      So, What's Next?

      2022 will also bring about another big change. As you already may have noticed, next month will be my last month at Van Lanschot Kempen.
      On February 1st I will join Powerdobs as their Unit Lead Power BI! It's a small consultancy company, located in Den Bosch, focused on the (Azure) Data Platform and Power BI.
      So out of my comfort zone, back into consultancy. More focus on Power BI, but also the connecting parts on the Azure data platform, so I wouldn't be surprised if there are going to be some posts and/or certifications around that.

      I wish everyone the best, a happy new year, and good health for you and your loved ones in 2022!


      Nicky,
      Out.

      Friday, December 24, 2021

      Power Query Trick: Remove (Only) Leading/Trailing Zeroes From Text

      Just before the holidays start, I'd like to share this little trick I came across in Power Query.

      I recently had the need to remove zeroes (but it can be any character) from the beginning of a column.
      Turns out there's a perfect function for that :-)


      The documentation isn't totally clear about this, but for the 2nd parameter (trim) you can add a character you want to have trimmed. The description only mentions whitespace, but you can enter any character in that parameter.


      On a side note, I got this nice documentation page inside Power Query by using the #shared function, which I blogged about here.

      Text.Trim[Start/End]

      And in case you might need it, there's also a Text.Trim and Text.TrimEnd function:


      Now onto an example, I created a text column with some values via Enter Data:


      I have some combinations of text, numbers, leading and/or trailing zeroes and spaces.
      For my 1st example I used Text.TrimStart to remove (only) leading zeroes.
      I added a custom column and used the UI to add it like this:


      This gives me this nice result:


      Only zeroes at the start are trimmed, no spaces or zeroes at other places. Great, exactly what I needed!

      I also had a look at the other functions and their workings I mentioned:


      In case you want to test it yourself, I put the M code I used in my GitHub.

      Closing

      I hope you found this one useful, let me know if you already use this or are going to in the future!

      This (hopefully) might not be my last post of the year πŸ˜€, but just to be sure:

      Merry Christmas πŸŽ„πŸŽ…, a great new year πŸŽ† and happy holidays to you all!


      Friday, December 3, 2021

      My Favorite Power BI Desktop November Updates


      It's already 2 weeks ago that it came out, but I'd like to highlight a few of my top additions to Power BI Desktop in November, being:

      • The New Format Pane
      • Page and Bookmark Navigators
      • The Scorecard Visual
      • The new Google Sheets Connector

      New Format Pane

      The first one being the introduction of the New Format Pane.
      Because it is still in preview, you have to explicitly enable this feature in the options: File > Options and settings > Options > Preview Features > New format pane.
      I especially like the merged font settings, but there's a ton of new features there, so be sure to check out the blog post (Introduction of the New Format Pane (Preview)) for all the updates. Also be aware there's a few known issues mentioned at the bottom of that blog post.

      Page and Bookmark Navigators

      O. My. God. Page and Bookmark navigators is going to save everyone so, much, time!
      For example, creating page navigation is now just a click (ok, actually 3 clicks) away. This not only creates a bookmark and button for every page, it also keeps them in sync, it matches the order of your pages, deleting a page will update the bookmarks.
      Next to that, there's also a ton of formatting and padding options. Just awesome!
      The only thing I'd love to see added, is the fact that the page navigator would replicate to all your pages and also keeping it in sync after that. Alright, I guess I'll head over to ideas.powerbi.com πŸ˜€

      Scorecard Visual

      This month's update also brings the new Scorecard visual in Power BI Desktop.
      This will let you create a Scorecard and goals right inside Desktop.

      Picture taken from the Power BI blog post

      Just be aware that as of now, the visual might not behave as expected in Power BI Desktop yet. Creating a scorecard from Desktop isn't working yet, but the Power BI team is working on a fix (to the service) and it should be deployed very soon.
      This is of course tied to all the updates in Power BI Goals this month, which was also covered more extensively in this blog post last month: More easily integrate goals into all your business processes.
      Updates include (a.o.):
      • Goal level permissions
      • Power Automate integration
      • Moving goals in your scorecard (drag & drop)
      • Adjusting columns in the scorecard view

      New Connector: Google Sheets

      Starting this month you can now easily connect to a Google Sheet with this new connector. You only need the Google sheet URL, authenticate through OAuth and you're done! And the Power BI team listened to you, because it was the most upvoted connector-related idea on the ideas site.

      Wrap Up

      And if you really, like really, want to keep those pie charts in your reports, you might wanna check out the update to the Pie and donut chart rotation. πŸ˜† If you're not sure why I'm saying this, go read this paper by Stepen Few: Save the pies for dessert

      That's all for now. Go download the November update of Power BI Desktop and play with all the good stuff! Let me know what you think are the best added features.

      Featured Post

      Power Apps or Translytical Task Flows?

      I think I have gotten this question at least five or six times in the last few months, and with Translytical Task Flows reaching GA in the M...